The KTuner software has a tab based layout which can be configured to the layout you desire. You can even have multiple tables on one single tab.
Right clicking allows you to add gauges, lights, tables, and other available items quickly to a tab.
Right clicking on gauges will allow you to set item types or remove items.
Dragging an item will allow you to place it anywhere on the tab.
Holding shift and dragging a resizable item will resize it. When resizing a table make sure you’re clicking an area that is outside of the table and graph.
Adding additional tabs is easy, too.
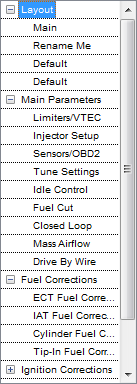
You can add additional tabs or remove existing tabs by right clicking the Navigation List in the Layout section.
Double clicking the name in the list will allow you to rename it.
Each additional tab you add can have it's own set of gauges, lights, and tuning tools setup anywhere you like on the screen.
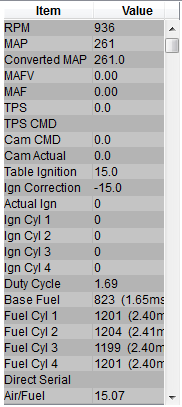
Even further than that you can add items directly to parameter tabs as well, so you have quick access to the sensor data you need to make your adjustments.
Once you have your layout designed you can datalog by simply connecting. The gauges, tables, and other data items will be updated in real-time.
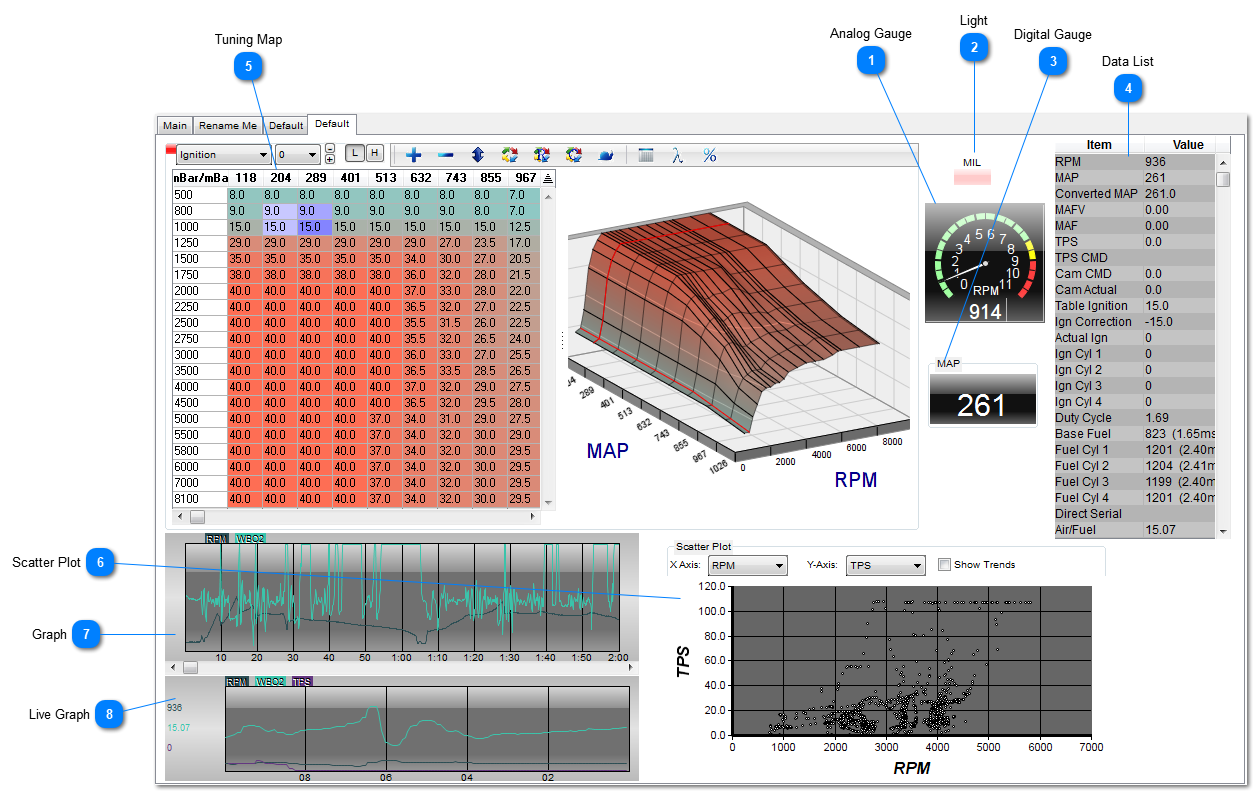
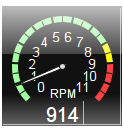
Analog Gauge
Analog Gauges can be added for most major sensors. These can be resized by holding shift while dragging.
Lights can be added to show the status of inputs, outputs, and special features. They will light up when the set item is active and dull when inactive.
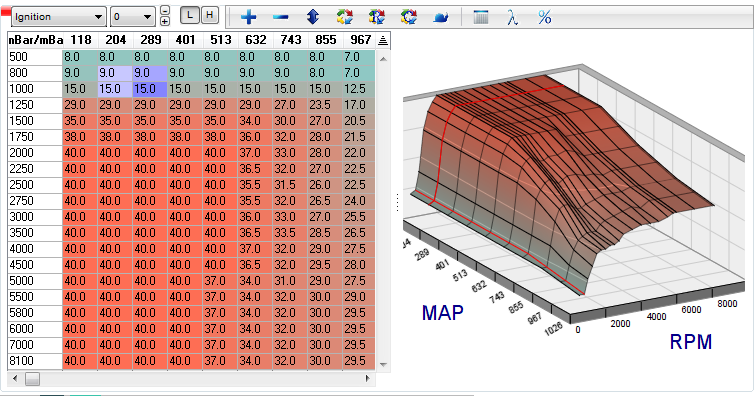
A Tuning Map can be added to allow altering of fuel, ignition, and other maps. This features map tracing, lambda overlay, and other options. You can also resize by holding shift while dragging in any of the top or bottom corners. The 2D/3D section can also be resized using the line of dots you see in between the table and 2D in the image above.
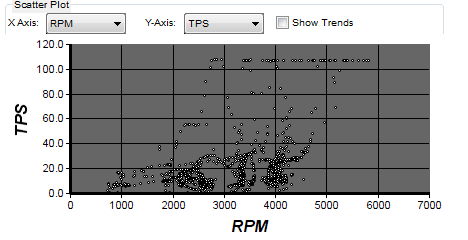
A Graph can be added to view overlays of the sensor data from a recorded data. Move and resize (Shift-click-drag) using the top area. You can scrub through a datalog by dragging. This will also allow you to trim the datalog, zoom via the toolbar, and add comments by double clicking. You can add as many items as you want.
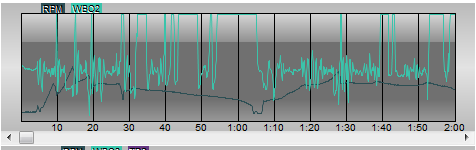
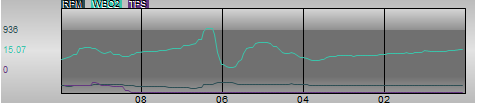
A Live Graph can be added to see the last 10 seconds of data overlayed as a moving graph. You can add as many items as you want. Move and resize (Shift-click-drag) using the top area.